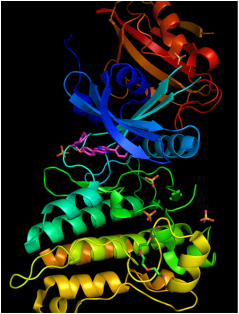
Image 1: This is an image of the transmembrane activin A receptor protein that is encoded by the ACVR1 gene in humans. The red protein on the top of ACVR1 represents the protein inhibitor FKBP12. The image depicts how this inhibitor binds to ACVR1.
Protein Homology
Homology is similarities between two or more species due to shared ancestry (2,3,4). Homology can be in the context of molecular or structural similarities between species. An example of sequence homology is when two DNA or protein sequences are similar between species due to the fact the two species have evolved from a common ancestor. The common ancestor would possess a certain sequence that is retained in the two species that have evolved from the speciation event. Moreover, by evaluating the level of conservation in a DNA or protein sequence, an indication into the evolutionary relationship between various species can be inferred. (3). Protein and DNA sequences can change throughout time by accumulating and retaining mutations. In general, species with similar protein sequences tend to be more closely related and have more recently diverged from a speciation event. Proteins that are similar between species are said to be conserved. These protein sequences can be derived from using a BLAST search. This search will yield a FASTA format of the protein sequence. Using BLAST, two FASTA formatted sequences between species can be compared by aligning them (5). By deducing similarities and differences between these sequences, a percent identity can be derived by the user. Overall, this determines how similar proteins are between model organisms.
Basic Local Alignment Search Tool, otherwise known as BLAST, is a bioinformatic technique that allows for the comparison between sequences of nucleotides or amino acids by aligning them and assessing the similarities (2). BLAST has important utility in identifying homologs for a particular protein or gene sequence of interest in a different species. BLAST works by taking the sequence of interest and comparing it to the other sequences in the database to find ones that are the most similar. Researchers utilized BLAST in order to find homologs of ACVR1, which is the diseased gene in FOP. The example below summarizes the protein homologs to the human ACVR1 protein.
ACVR1 Protein Homology
|
Homo sapiens (humans)
activin A receptor, type I (ACVR1) Accession: NP_001096.1 509 aa Pan troglodytes (chimpanzee) activin A receptor, type I (ACVR1) Accession: XP_001145316.1 509 aa 99% identical Macaca mulatta (rhesus macaque) activin A receptor, type I (ACVR1) Accession: NP_001247690.1 509 aa 99% identical Canis lupus (grey wolf) activin A receptor, type I (ACVR1) Accession: XP_005640253.1 509 aa 99% identical Bos Taurus (cattle) activin A receptor, type (ACVR1) Accession: NP_788836.2 509 aa 99% identical Mus muscus (mouse) activin A receptor, type I (Acvr1) Accession: NP_001103674.1 509 aa 98% identical Rattus norvegicus (rat) activin A receptor, type I (Acvr1) Accession:NP_077812.1 509 aa 97% identical |
Gallus gallus (chicken)
activin A receptor, type I (ACVR1) Accession: NP_989891.1 504 aa 84% identical Xenopus tropicalis (Western clawed frog) activin A receptor, type I (acvr1) Accession: NP_001017357.1 512 aa 81% identical Caenorhabditis elegans (nematode) daf-1 Accession: NP_001023159.1 669 aa 40% identical Danio rerio (zebrafish) activin A receptor, type I (acvr1) Accession: NP_571420.1 506 aa 69% identical Drosophila melanogaster (fly) Saxophone (sax) Accession: NP_001246193.1 582 aa 55% identical Anopheles gambiae (mosquito) AgaP_AGAP007729 Accession: XP_308147.4 569 aa 51% identical Felis catus (cat) Activin A receptor, type I Accession: M3W8V8 509 aa 99% identical |
Analysis:
Similarly to gene homology, the protein homology demonstrates that this protein is conserved throughout a variety of species. Not only is the protein conserved in these species, the protein remains nearly identical in a variety of vertebrates. This indicates that this protein has an importation function in all these species. Unlike the gene homology, there is a homolog to ACVR1 protein in invertebrates such as the fruit fly and nematode. Although these proteins have a different name (sax and Agap), they all have at least a 40 percent or greater percent identity. Overall, this indicates that this protein sequence is retained in some form across many species.
Similarly to gene homology, the protein homology demonstrates that this protein is conserved throughout a variety of species. Not only is the protein conserved in these species, the protein remains nearly identical in a variety of vertebrates. This indicates that this protein has an importation function in all these species. Unlike the gene homology, there is a homolog to ACVR1 protein in invertebrates such as the fruit fly and nematode. Although these proteins have a different name (sax and Agap), they all have at least a 40 percent or greater percent identity. Overall, this indicates that this protein sequence is retained in some form across many species.
ACVR1 Phylogeny
What is phylogeny?
Phylogeny is the study of the relatedness of species through evolution (1). This relationship between species can be obtained from comparing the DNA or protein sequences between these species. The visual representation of the relatedness of organisms is called a phylogenetic tree. There are various ways in which these phylogenetic trees can be calculated and generated. The ways in which a phylogenetic tree can be constructed are outlined below.
Obtain and format sequences
Using the FASTA formatted protein sequences obtained for BLAST (see homology section above), take the sequences and format them as shown in the document below. This example uses the ACVR1 protein homologs. As mentioned prior, ACVR1 is the aberrant protein involved in FOP.
Align sequences
Using ClustalWOmega, copy and paste formatted sequences into the website. This website will align the sequences. In order to observe this alignment click “result summary.” On this tab, click “start Jalview.” A pop up window will appear depicting the alignment of the sequence and should look similar to the image below.
Using ClustalWOmega, copy and paste formatted sequences into the website. This website will align the sequences. In order to observe this alignment click “result summary.” On this tab, click “start Jalview.” A pop up window will appear depicting the alignment of the sequence and should look similar to the image below.
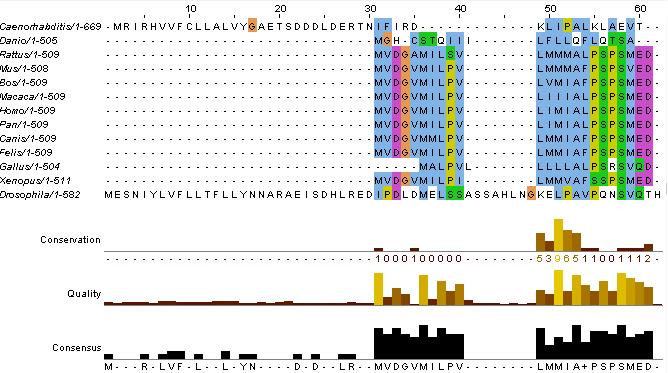
Image 2: Alignment of protein homolog sequences from ClustalWOmega. These sequences in the aligned fashion help identify the similarities and differences between species.
Generate Trees
Phylogenetic trees help to visualize the evolutionary relationship between species. There are a variety of ways to create phylogenetic trees. The different ways are described below.
Blosum Matrix
(Blocks Substitution Matrix) is a method used to derive a phylogenetic tree. This tree is generated from getting a score. The score is predicted from looking at the alignments of all the amino acids and scores them based on how likely it is that a particular amino acid occurs in a particular part of the peptide by chance. These scores get summed and reflect the evolutionary relationship between these species.
Percent Identity
This method finds the percent of the sequence that is identical. With that information, there are two further subcategories that determine how the tree will be generated. These two categories for constructing the tree are neighbor joining and average distance.
Neighbor Joining
Similarly to BLOSUM, this method scores every pair of amino acids and calculates the amount of change between two species. These two species with the highest identity are considered sister taxa. Sister taxa are connected at a node which signifies a common ancestor. The size of the branch correlates with the amount of change in the protein sequence. Image three and four illustrate the phylogenetic tree for ACVR1 with the homologs shown above. For clarity to see the relationship between all the species, image three shows image four but just more spread out. Image three is not drawn to scale and does not take into consideration the characteristic branch length calculations of neighbor joining.
Average Distance
This method is used for constructing trees as well. This method also entails using scores to determine how closely related species are and connecting them at a node. The exception is that average distance trees assume that the species all diverged equally from a common ancestor. Because of this assumption, the branches all have equal end points. This is dissimilar to neighbor joining methods in which the branch lengths are associated with the amount of change in the protein sequence. Image five and six depict the results obtained from ClustalWOmega
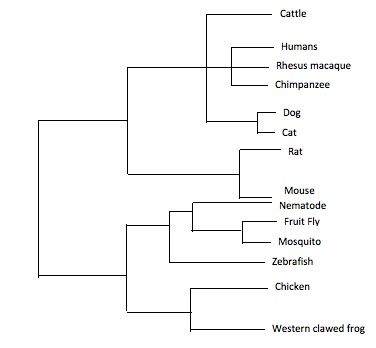
Image 3: Neighbor Joining Using % Identity. The image is not drawn to scale
|
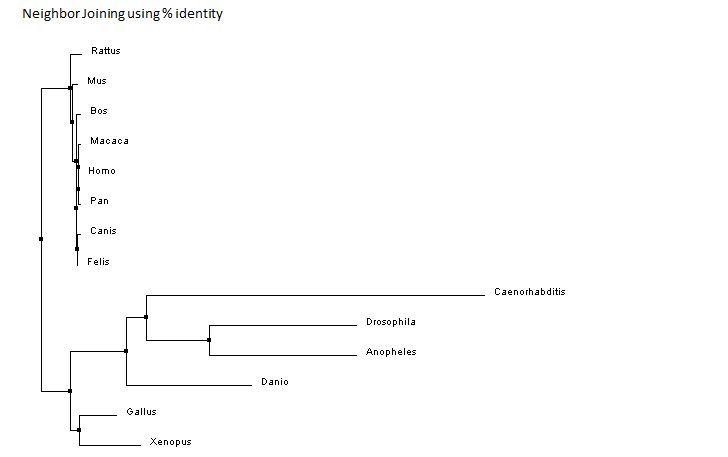
Image 4: Neighbor Joining Using % Identity as shown from ClustalWOmega
|
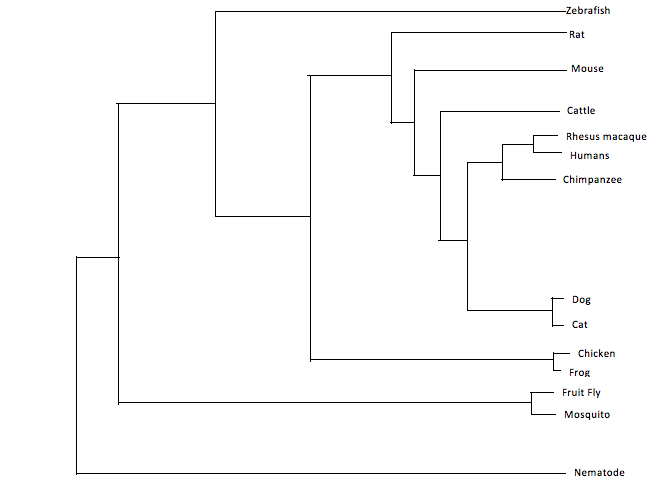
Image 5: Average Distance Using % Identity. The image is not drawn to scale.
|
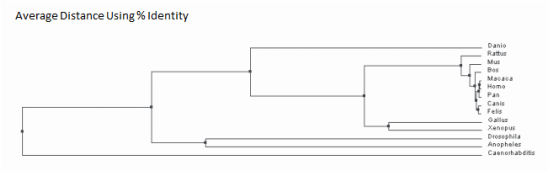
Image 6: Average Distance Using % Identity as shown from ClustalWOmega
|
Analysis:
Despite the fact these two trees are constructed in a different manner, they are relatively similar. Both trees have similar groupings of sister taxa. For example, in both trees, dogs and cats are located in the same taxa, as well as fruit flies and mosquitoes. Additionally, both trees predict that the mammals such as rats, mice, humans, chimpanzees, cattle, cats, dogs and rhesus macaques are the most related. Moreover, the more distantly related species are consistently seen as being the invertebrates and non-mammal vertebrates. Examples include the fruit fly, mosquito, nematode, zebrafish, chicken and frog. These findings are consistent with the percent identity found from the protein homology percent identity. The most distantly related are consistently the mosquito, fruit fly, nematode and zebrafish. Considering the human ACVR1 was found on BLAST to be 98 percent identical to the chimpanzee, rhesus macaque, dog, rat, cat and mouse homolog, it is not surprising that the tree suggests these proteins and organisms are closely related. Additionally, the western clawed frog and chicken are 81 percent and 84 percent identical to the human homolog which would explain why the tree has them the next ancestor out followed by the invertebrates. Overall, these trees are constructed slightly different on where the nodes are located although they still depict approximately the same relationship between species.
Despite the fact these two trees are constructed in a different manner, they are relatively similar. Both trees have similar groupings of sister taxa. For example, in both trees, dogs and cats are located in the same taxa, as well as fruit flies and mosquitoes. Additionally, both trees predict that the mammals such as rats, mice, humans, chimpanzees, cattle, cats, dogs and rhesus macaques are the most related. Moreover, the more distantly related species are consistently seen as being the invertebrates and non-mammal vertebrates. Examples include the fruit fly, mosquito, nematode, zebrafish, chicken and frog. These findings are consistent with the percent identity found from the protein homology percent identity. The most distantly related are consistently the mosquito, fruit fly, nematode and zebrafish. Considering the human ACVR1 was found on BLAST to be 98 percent identical to the chimpanzee, rhesus macaque, dog, rat, cat and mouse homolog, it is not surprising that the tree suggests these proteins and organisms are closely related. Additionally, the western clawed frog and chicken are 81 percent and 84 percent identical to the human homolog which would explain why the tree has them the next ancestor out followed by the invertebrates. Overall, these trees are constructed slightly different on where the nodes are located although they still depict approximately the same relationship between species.
References:
1. Baum, D. (2008) Reading a phylogenetic tree: The meaning of monophyletic groups. Nature Education 1(1):190
2. "Discover Homologs." National Center for Biotechnology Information. U.S. National Library of Medicine, n.d. Web. 27 Mar. 2015. <http://www.ncbi.nlm.nih.gov/homologene>.
3. "Homologous Genes." Homologous Genes. N.p., 2004. Web. 27 Mar. 2015. <http://evolution.berkeley.edu/evolibrary/article/1_0_0/eyes_10>.
4. Cui, Xf ; Vinar, T ; Brejova, B ; Shasha, D ; Li, M. "Homology search for genes". Bioinformatics, 2007 Jul 1, Vol.23(13), pp.I97-I103. http://bioinformatics.oxfordjournals.org/content/23/13/i97.full
5. "Multiple Sequence Alignment." Clustal Omega. EMBL-EBI, n.d. Web. 27 Mar. 2015. <http://www.ebi.ac.uk/Tools/msa/clustalo/>.
Image References
1. https://kinasepro.wordpress.com/2009/05/11/acvr1-fkbp12/
2-6. http://www.ebi.ac.uk/Tools/msa/clustalo/
